Comparing '21 & '22 Sales Trends: Palo Alto, Los Altos & Santa Clara County
- jenchui
- Aug 8, 2022
- 1 min read
Updated: Oct 18, 2022
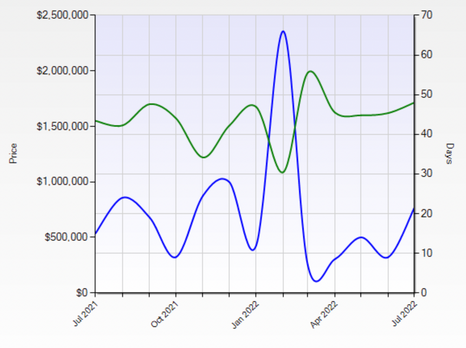
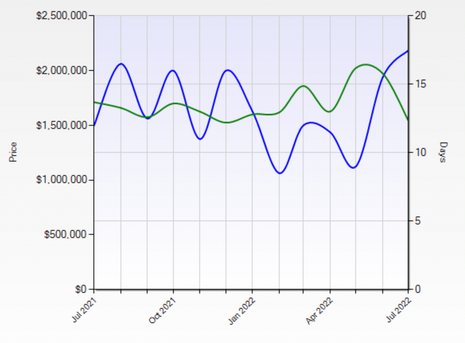
With rising mortgage interest rates and increase in inventory levels, housing market has cooled down a bit. But how is it compared to the same time period last year? Below you can see the monthly trends of Median Price and Median Days to Sell for Palo Alto & Los Alto cities and Santa Clara County. While nobody has an accurate crystal ball for the future, data trends can provide an objective picture to help with your buying or selling strategy.
Subscribe and stay tuned for more trend postings for other cities and counties. If you are interested to see similar trends in specific cities or if there are other trends that would be useful for your planning, let us know! We are here to help you make the best data-driven decision.
City: Palo Alto
July 2020-21 vs July 2021-22
Single Family Homes
July '20 to July '21 | July '21 to '22 | As of Sept '22 | |
----- Median Price | $3.08M to $3.18M, +3% | $3.18M to $3.25M, +2% | $3.25M |
----- Median Days to Sell | 13 to 8, -38% | 8 to 11, +38% | 12 |
Townhomes and Condos
| July '20 to July '21 | July '21 to July '22 | As of Sept '22 |
|---|---|---|---|
----- Median Price | $1.28M to $1.55M, +21% | $1.55M to $1.72M, +11% | $1.39M |
----- Median Days to Sell | 28 to 15, -46% | 15 to 22, +47% | 42 |
Residential Income
| July '20 to July '21 | July '21 to July '22 | As of Sept '22 |
----- Median Price | $2.1M to $2.7M, +29% | $2.7M to $2.66M, -2% | $3.3M |
----- Median Days to Sell | 129 to 42, -67% | 42 to 58, +38% | 29 |
City: Los Altos
July 2020-21 vs July 2021-22
Single Family Homes
| July '20 to July '21 | July '21 to July '22 | As of Sept '22 |
----- Median Price | $3.32M to $4.14M, +25% | $4.14M to $3.75M, -9% | $4.1M |
----- Median Days to Sell | 9 to 8, -11% | 8 to 9, +13% | 10 |
July 2020-21 vs July 2021-22
Townhomes and Condos
| July '20 to July '21 | July '21 to July '22 | As of Sept '22 |
----- Median Price | $1.94M to $1.75M, +10% | $1.75M to $2.3M, +31% | $1.82M |
----- Median Days to Sell | 11 to 19, +73% | 19 to 8, -58% | 23 |
County: Santa Clara
July 2020-21 vs July 2021-22
Single Family Homes
| July '20 to July '21 | July '21 to July '22 | As of Sept '22 |
----- Median Price | $1.37M to $1.65M, +20% | $1.65M to $1.72M, +4% | $1.65M |
----- Median Days to Sell | 9 to 8, -11% | 8 to 14, +75% | 17 |
Townhomes and Condos
| July '20 to July '21 | July '21 to July '22 | As of Sept '22 |
----- Median Price | $820K to $900K, +10% | $900K to $946K, +5% | $920K |
----- Median Days to Sell | 13 to 9, -31% | 9 to 14, +55% | 20 |
Residential Income
| July '20 to July '21 | July '21 to July '22 | Latest: Sept '22 |
----- Median Price | $1.43M to $1.71M, +20% | $1.71M to $1.54M, -10% | $1.35M |
----- Median Days to Sell | 25 to 12, -52% | 12 to 18, +50% | 22 |


Comments